
M.A.P. : Multi Aster Photometry
M.A.P. does photometry on time series of images, analysing multiple stars in one go.
It has been optimised for speed, accuracy and user friendliness.
For the moment, november 2026, it is only available as a github project, later the .exe version for windows may reappear. Contact the author if required.
It has been optimised for speed, accuracy and user friendliness.
For the moment, november 2026, it is only available as a github project, later the .exe version for windows may reappear. Contact the author if required.
Due to the sheer amount of information presented it is best to use a big screen with lots of pixels (2560 * 1440 pixels)
Multi Aster Photometry, what's in a name ?
Older photometry programs allowed only one star in a time series to be analysed per run, MAP can analyse all in one go.
So, Multi points to Multiple, Aster is Latin for Star, and then we add Photometry, which gives : Multi Aster Photometry, or M.A.P.
The old name of the project was AstroPie, with the Pie from Pieter. It sometimes still appears on some screens.
How to install M.A.P. - Multi Aster Photometry?
If you have the exe version for Windows (old) : Installation M.A.P.
What are the components of M.A.P ?
The Dashboard guides you through all the different steps for the Photometry
- Default Values : change the default values for your setup. More than one setup is possible : More about Default Values
- Calibration : calibrate your photo's before measuring them : More about Calibration
- Star Groups : define for a field of view what stars have to be analysed. Of course, all stars will be analysed in one single run ! More about Star Groups
- Star Groups : before choosing the directory with the photo's to be analysed, choose the corresponding Star Group. More about choosing a Star Group
- Choose directory with the photo's to be analysed.
Photometry is launched by choosing the folder with the Science Frame (photo's)
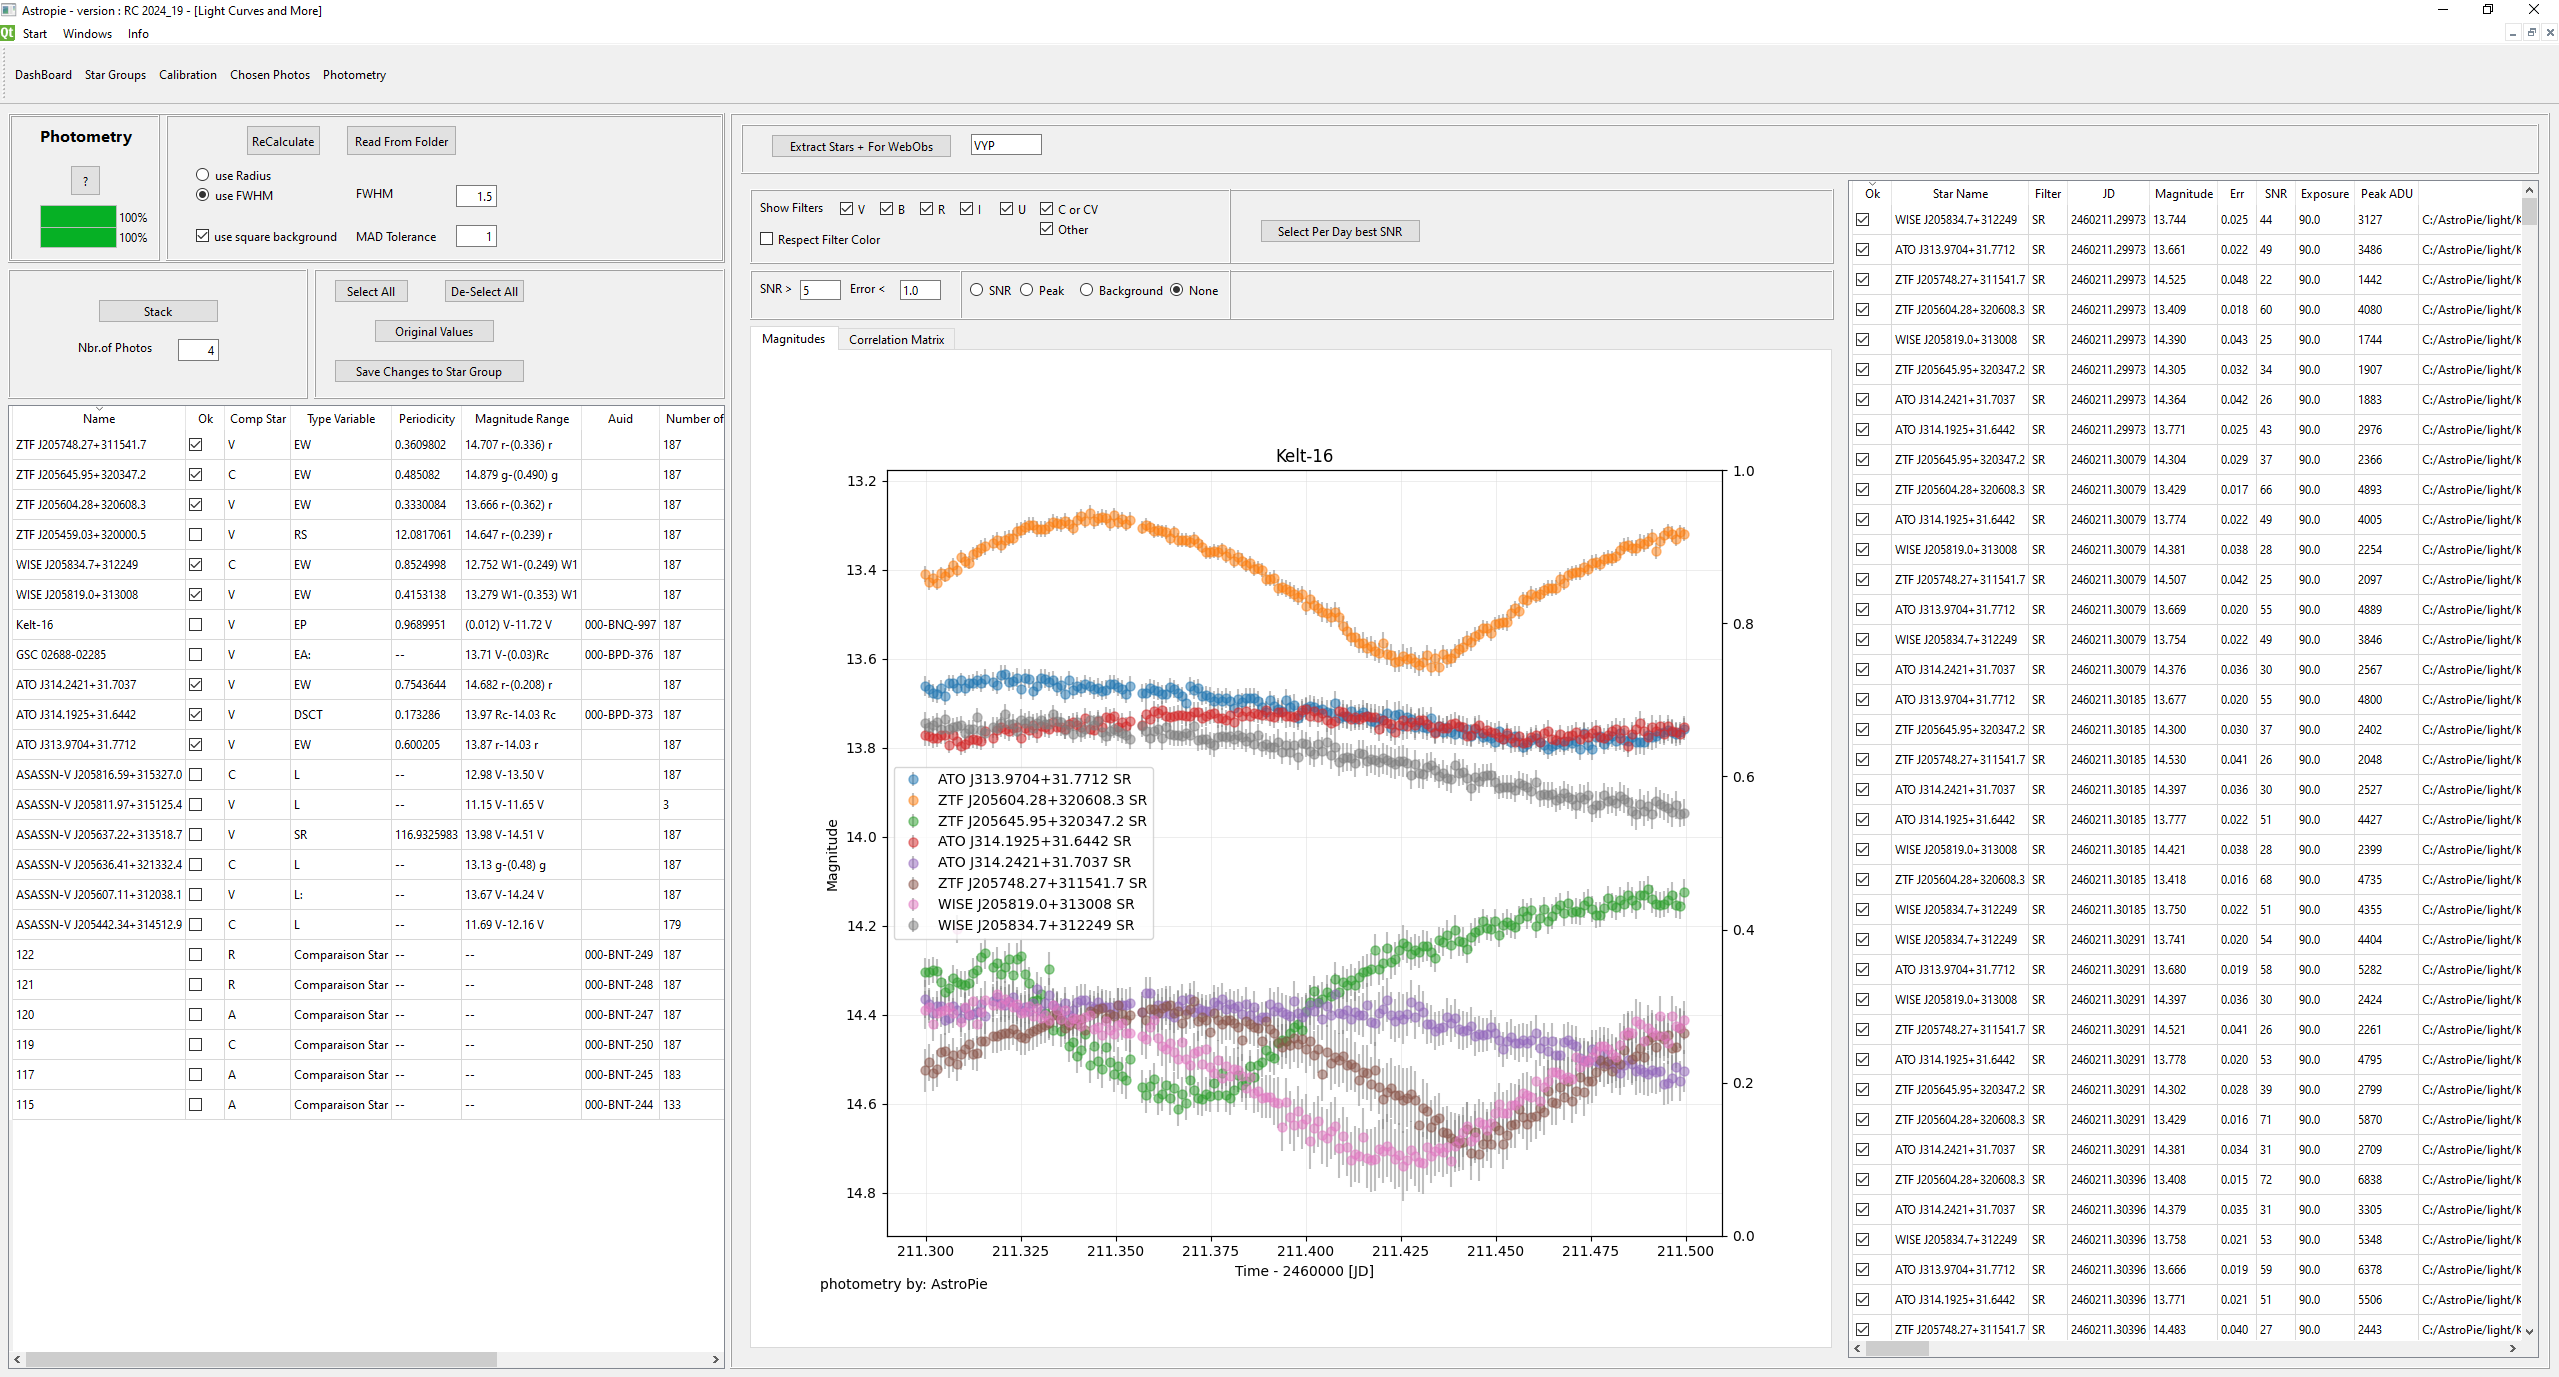
- Photometry : the screen with the results, and allowing some extra manipulation.
- Show A Lot Of Graphs : fine details of the photometry, relative flux, total flux, FWHM, background, and many more. About A Lot Of Graphs
- Show A Lot Of Apertures : have a look at the apertures and annulus of the stars. About A Lot Of Apertures
- Show Photo : put the Star Group stars on a photo, and verify exposure times for clipping Show a Photo
Some General Tricks
- Help is availble through the "?"- buttons on each screen, and on the dashboard
- Each figure can be saved to disk : right click on it and choose where to put it
- Tables : click on the header field of a table and the table will be sorted by that field. Click another time and the sort order will reverse
Is M.A.P. the Absolute Perfection ?
No.
But almost. Well, if you experiment a bit to find the best way to use it.
I started working on M.A.P. because other softwares that were available back then gave results I could not explain. Too many measurements were obviously not completely correct, no explanation could be found why.
Therefore I wrote the subprograms ALotOfGraphs and ALotOfApertures to get a better idea of what happened. It allowed me to add some fine tunings that diminished the inexplicable errors other software gave sometimes.
So Absolutely Perfect ?
No : one of the remaining finetunings are hot/cold (bad) pixels. When they happen in the background, the problem has been solved, but when they happen inside the pixels of the star, there is something not completely ok. As stated in the AstroPy documentation :
If the object of interest happens to fall on one of the bad pixels you may well notice it. In time series photometry this sometimes manifests as a single data point that is well outside the trend in the rest of the data.
Hint :
Most of the unexplicable errors are due to bad calibration. That can be old darks (warm pixels tend to become hotter by the time), or bad flats.
More information about that in the Calibration help pages : More about Calibration
Coming Soon (all is relative)
- Update of the documentation. Most of the texts are three years old, and MAP has kept evolving.
- Pipeline : analysing your time series in an automatic way.
- Bad Pixel Maps : finetuning of this functionality
- Suggestions ? -> contact Pieter.
A Lot Of Thanks Go To ...
M.A.P. has been tailored to the needs of my own setup needs for doing photometry.
But, in order to verify other setups and other needs for photometry I want to thank Hubert Hautecler, Josch Hambsch, Joost Verheyden,Gunther Fleerackers and Franky Dubois !
But, in order to verify other setups and other needs for photometry I want to thank Hubert Hautecler, Josch Hambsch, Joost Verheyden,Gunther Fleerackers and Franky Dubois !
Tests on thousands of photos with hundreds of stars on one run, tests nthe logical way of working with the GUI, bug fixing, documenting effects of calibration, and so on...
M.A.P.. is making use of :
- ASTAP : ASTAP website
- AAVSO VSX database
- Vizier UCAC4 and GaiaDR3 databases
- AstroPy : http://www.astropy.org
- PhotUtils : https://photutils.readthedocs.io/en/stable/index.html
- QT via PyQt6 : https://pypi.org/project/PyQt6/
- Python : Python website